Some Meraki users have on-prem devices such as Cisco Catalyst during their migration phase. The cloud enables users to push some of their responsibility to the vendor and thus, became the mainstream solution for IT. In detail, administrators can offload disk management, version control, network management, and so on for them to focus on business outcomes. For these reasons, on-prem solutions are starting to become obsolete. In order to migrate from on-prem to cloud, not only do admins need to plan replacing or decomissioning gear, but they also need to consider how to monitor and maintain their new solution. Log management is definitely part of this and it’ll be a shame if the IT team needed to manage two systems, on-prem and cloud, during the transition. Datadog can consolidate logs from multiple sources including syslog and SNMP traps which makes a perfect solution to use.
For testing purposes, we will use a Cisco Catalyst for the syslog and SNMP generator and also spin up a Ubuntu EC2 instance in AWS. The Ubuntu instance will have Datadog agent installed. The physical site has a Meraki MX and a vMX also exists in AWS allowing connection between the Cisco Catalyst and Datadog agent via Auto VPN.
This blog post will go through the installation and configuration steps of Datadog, but will go through setting up Auto VPN. If you need instructions on steps to configure Auto VPN, refer to the following posts.
- Install Datadog Agent
- Configure Datadog Agent
- Configure Cisco Catalyst
- Test SNMP and Syslog
Configuration
Install Datadog Agent
Installing Datadog is simple. Navigate to Integrations > Agent on Datadog, and choose your operating system. Once selected, copy the easy one-step install command, and paste it into the Ubuntu CLI.
Make sure the AWS EC2 instance allows incoming traffic for SNMP trap and syslog. The default port number for SNMP trap is 162 and syslog is 514. In this scenario, I will use 514 so I do not have to give special permission for Datadog to listen to a common port. If you absolutely want to receive syslog on port 514 follow the steps at the very end.
Configure Datadog Agent
The Datadog agent requires different ways of configured SNMP Trap and syslog. Follow the instructions in each section to properly configure them. In addition, don’t forget to restart the agent after configuration.
SNMP Trap
In order to receive SNMP traps with the Datadog agent, change the configuration file located at /etc/datadog/datadog.yaml. In detail, find snmp_traps_enabled at the very end of this file and change as required. Please see example below, and make sure to add bind_host: 0.0.0.0, so that the agent can listen to the packets received.
## @param snmp_traps_enabled - boolean - optional - default: false
## Set to true to enable collection of traps.
#
snmp_traps_enabled: true

## @param snmp_traps_config - custom object - optional
## This section configures SNMP traps collection. Traps are forwarded as logs to Datadog.
## NOTE: This feature is currently **EXPERIMENTAL**. Both behavior and configuration options may
## change in the future. Only SNMPv2 is supported.
#
snmp_traps_config:

  ## @param port - integer - optional - default: 162
  ## The UDP port to use when listening for incoming trap packets.
  #
  port: 162

  ## @param community_strings - list of strings - required
  ## A list of known SNMPv2 community strings that devices can use to send traps to the Agent.
  ## Traps with an unknown community string are ignored.
  ## Enclose the community string with single quote like below (to avoid special characters being interpreted).
  ## Must be non-empty.
  #
  community_strings:
    - '<community string>'

  ## @param bind_host - string - optional
  ## The hostname to listen on for incoming trap packets.
  ## Defaults to the global `bind_host` config option value.
  #
  bind_host: 0.0.0.0

  ## stop_timeout - float - optional - default: 5.0
  ## The maximum number of seconds to wait for the trap server to stop when the  Agent shuts down.
  #
  stop_timeout: 5.0
Here are the exact instructions if you are not comfortable with the command line interface.
- sudo vi /etc/datadog/datadog.yaml
- Hit ? key
- Type snmp_traps_enabled and hit enter key
- Hit i key
- Move around with arrow keys and remove comment (#) from line snmp_traps_enabled:
- Remove comment (#) from line snmp_traps_config:
- Remove comment (#) from line port: 162:
- Remove comment (#) from line community_strings:
- Remove comment (#) from line – ‘<COMMUNITY_1>’
- Replace <COMMUNITY_1> with your SNMP community name. Keep the single quotation (‘) around it
- Remove comment (#) from line bind_host: <BIND_HOST>
- Replace <BIND_HOST> with 0.0.0.0
- Remove comment (#) from line stop_timeout: 5.0
- Hit esc key
- Type :wq and hit enter key
Syslog
For syslog, following the steps below for the Datadog agent to read the received syslog messages.
- Execute sudo mkdir /etc/datadog-agent/conf.d/cisco.d
- Execute sudo vi /etc/datadog-agent/conf.d/cisco.d/conf.yaml
- Hit i key
- Copy the paste the following
logs:
  - type: udp
    port: 1514
    service: "syslog"
    source: "cisco"
- Hit esc key
- Type :wq and hit enter key
If you absolutely want to receive syslog on port 514, execute the following command.
sudo setcap CAP_NET_BIND_SERVICE=+eip /opt/datadog-agent/bin/agent/agentAfter configuration, restart the agent with the below.
sudo service datadog-agent restartConfigure Cisco Catalyst
SNMP Trap
Enter the following commands by replacing <IP of Datadog agent> and <community string>.
snmp-server host <IP of Datadog agent> version 2c <community string>
snmp-server enable traps
Syslog
I have configured the following to my Catalyst switch. Replace <IP of Datadog agent>.
service timestamps debug datetime msec localtime show-timezone
service timestamps log datetime msec localtime show-timezone
service sequence-numbers
logging trap informational
logging origin-id hostname
logging host <IP of Datadog agent>
The sequence-numbers will help to confirm there are no drops, and including the hostname to the trap is very important if you have multiple switches in the environment. Traditional syslog servers will record the source IP of the syslog message, but the Datadog agent will not transfer this information to its cloud. Therefore, it is important to add the hostname to the syslog message, so you can differentiate the source.
Test SNMP and Syslog
The easiest way to send a SNMP or syslog message is to enter global configuration mode and exit out of it. You can verify this behavior by turning on debugs.
3560-A#debug snmp packets
SNMP packet debugging is on
3560-A#terminal monitor
3560-A#conf t
Enter configuration commands, one per line. End with CNTL/Z.
3560-A(config)#
008429: Oct 29 19:25:44.488 AEDT: SNMP: Queuing packet to 172.16.100.49
008430: Oct 29 19:25:44.492 AEDT: SNMP: V2 Trap, reqid 334, errstat 0, erridx 0
sysUpTime.0 = 4168946227
snmpTrapOID.0 = ciscoConfigManMIB.2.0.1
ccmHistoryEventEntry.3.344 = 1
ccmHistoryEventEntry.4.344 = 2
ccmHistoryEventEntry.5.344 = 3
008431: Oct 29 19:25:44.740 AEDT: SNMP: Packet sent via UDP to 172.16.100.49
3560-A(config)#end
3560-A#
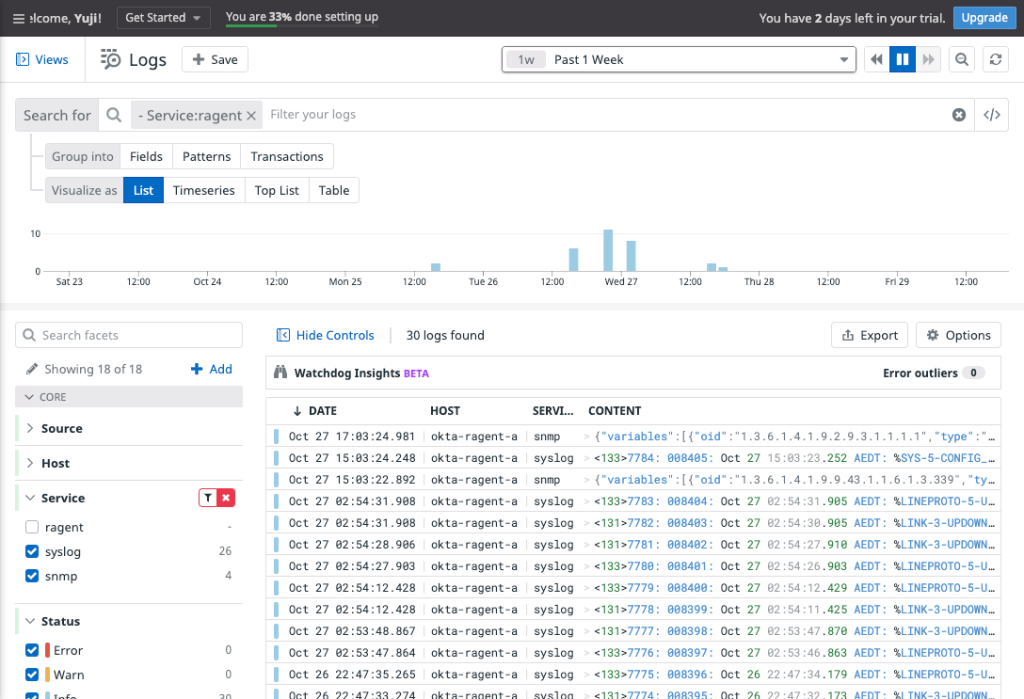
008432: Oct 29 19:25:51.021 AEDT: %SYS-5-CONFIG_I: Configured from console by vty0 (192.168.10.152)View SNMP Trap and Syslog on Datadog
Navigate to Logs > Search, and the SNMP Trap and syslog should be there.